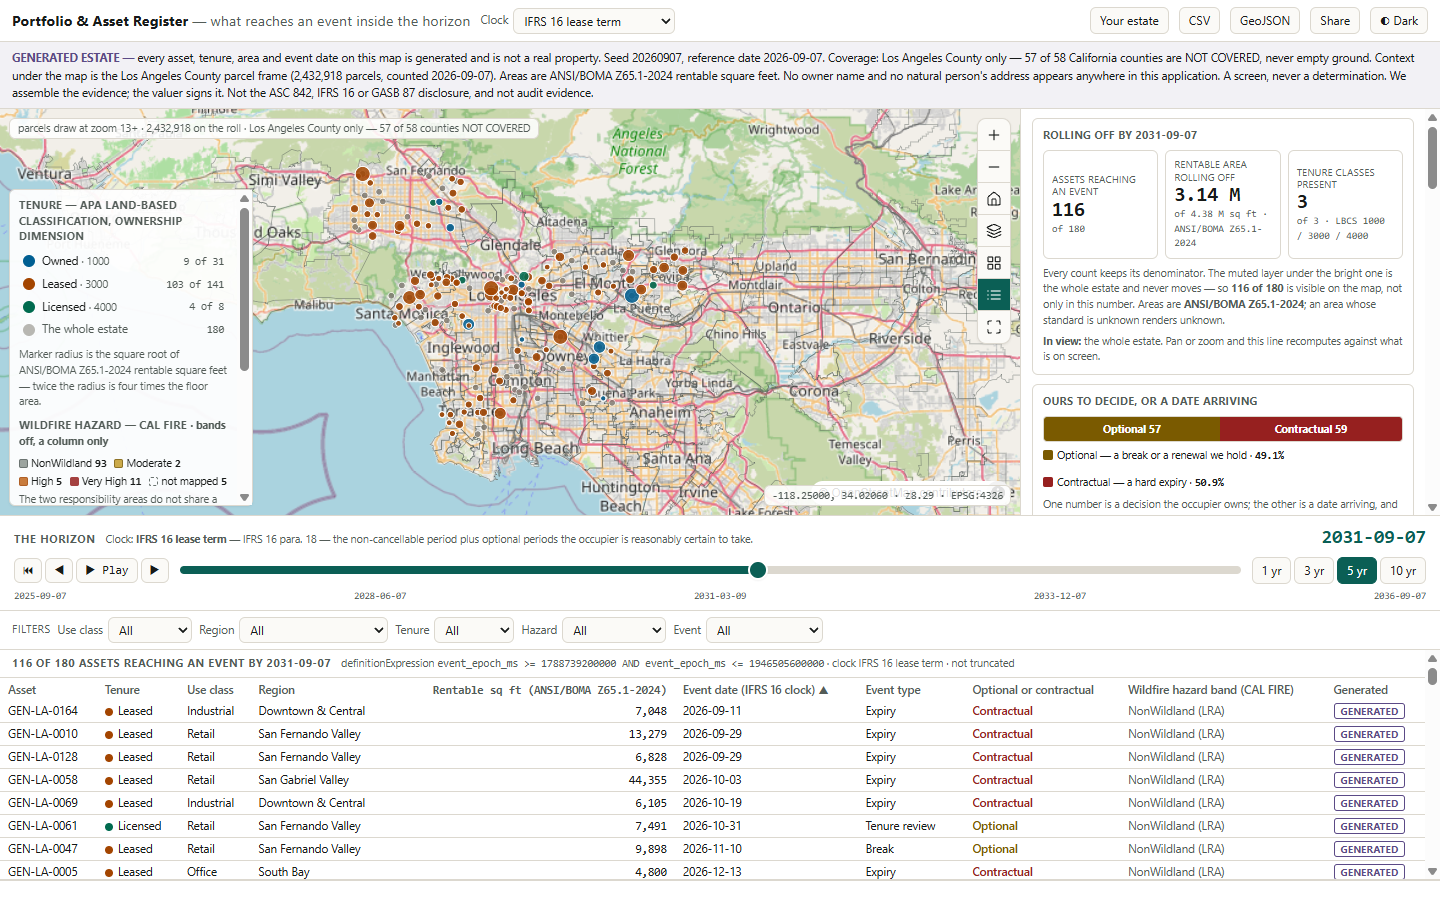
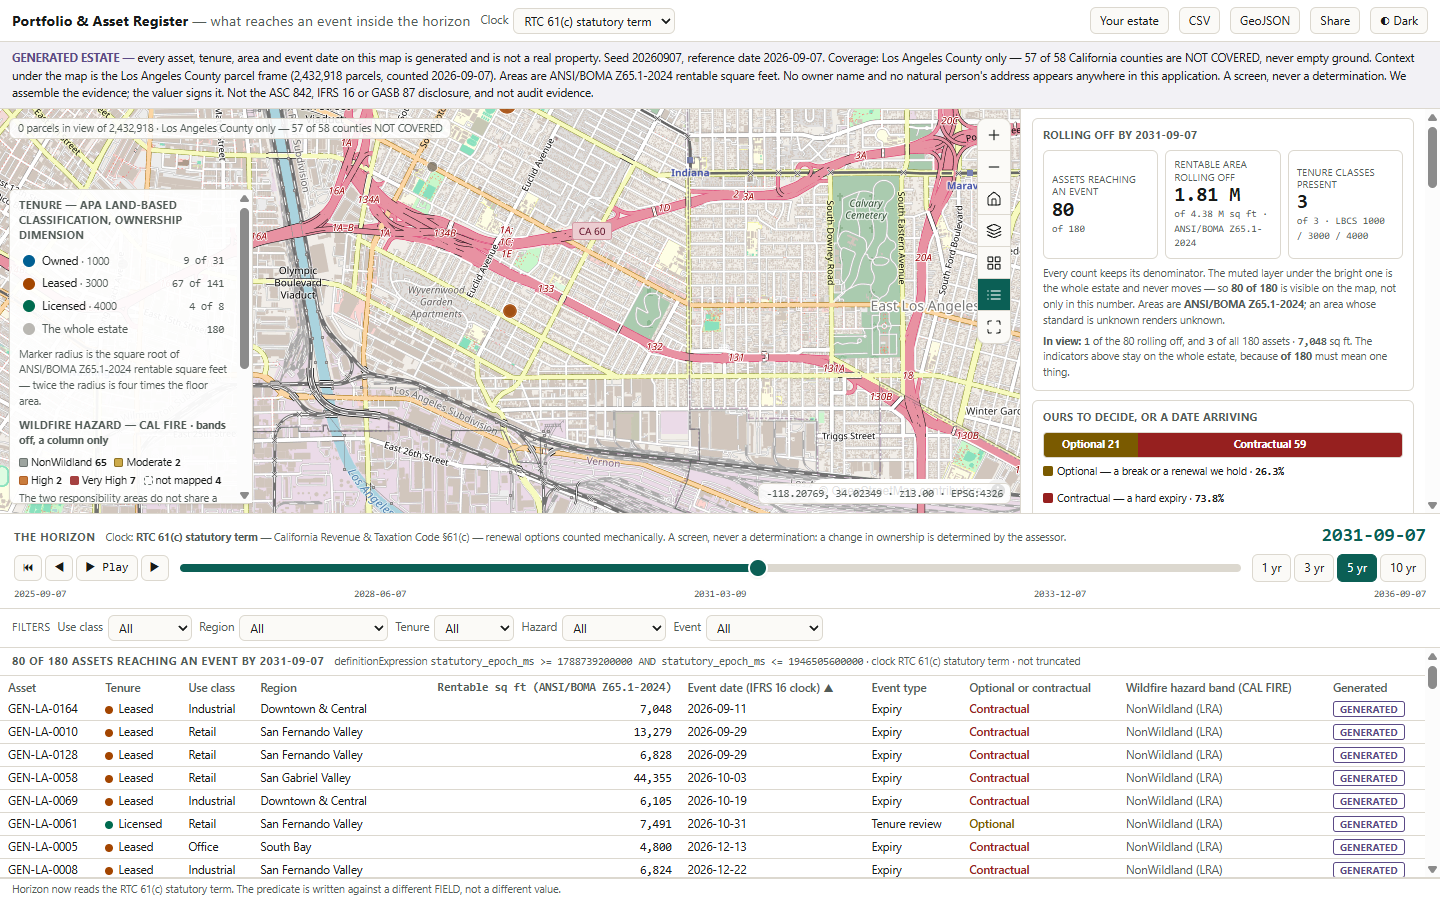
A lease event is an expiry, a break option or a renewal date. Your finance team already reports lease payments by year for the accounts. That report does not say which buildings, where they are, or how much space. This app shows it on a map.
These are decisions for the head of corporate real estate. They depend on what you hold and when each lease or ownership position comes up. This app is not a valuation, an accounts disclosure or a facilities tool.
Most firms already keep a register of what they own and lease. What is usually missing is a clear view of what comes up for decision within your planning period, which we call the horizon, and where those buildings are.
The app opens at the five-year horizon, so you see this picture straight away.
| Product | What it does well | What is missing |
|---|---|---|
| CoStar Real Estate Manager · Accruent Lucernex · Visual Lease · Nakisa | lease accounting (ASC 842, IFRS 16), alerts before key dates, renewals | No map |
| MRI ManhattanONE | built for occupiers, so the closest match by buyer | No map |
| IBM TRIRIGA → Maximo Real Estate & Facilities | lease records in one place, space planning | No map, and being replaced |
| Esri real-estate solutions | every property on a map, with occupancy, maintenance and value | No leases or expiry dates |
| MSCI Real Capital Analytics · Cherre (RealPage) | large deal and performance datasets ($50 tn of transactions, 80+ indexes) | Built for investors, not for an occupier's estate |
| The accounting standards (ASC 842 · IFRS 16 · GASB 87) | a table of future lease payments: each of the next five years, then the rest | Money only. No buildings, no locations |
The lease report you already produce for the accounts is a table by year. It adds up the cash and leaves out which buildings, where, and how much space.
Based on each vendor's own web pages, read on 7 September 2026. Two vendor pages could not be read and are not used here.
The lease term is the fixed period plus any extension you are reasonably certain to take. That is a judgement, so the app shows whose judgement the date is.
A lease of 35 years or more, counting all renewal options, triggers a property-tax reassessment. Here every option counts, whether you plan to use it or not.
The accounting rule counts an option only if you expect to use it. The tax rule counts it because it is in the lease. So the same lease can end in different years, depending on the rule.
You choose the rule in the app. The rule in use is shown on screen and on every export. Leases where the two rules disagree are flagged and can be filtered. The tax view is a first check only. The actual decision belongs to the county assessor.
Instead of cash by year, the app shows how many properties reach a lease event by your chosen date, how much floor area that is, and where they are. It also splits them into events you control and events that simply arrive.
Two numbers, not one. A break option or a renewal gives you room to negotiate. A fixed expiry is a deadline. Adding them together hides the difference that matters most.
36 properties and 1.33 million sq ft move, although nothing about the estate has changed. Fixed expiries are the same under both rules (59). Every property that moves has an option that the two rules treat differently.
The US federal government publishes its list of leases. A break (termination) date is filled in on 7,367 of 7,368 leases. That suggests almost every lease has a break option. It does not.
Why it matters: each date looks valid on its own. The problem only shows when you compare the break date with the expiry date. After the fix, more of the coming events are fixed deadlines than it first appeared.
With live break options identified, the app can show the first date you need to act. 5,100 of 7,133 current leases (71.5 %) reach that point within five years, carrying $3.29 bn of annual rent. Counting expiries only, as the accounting report does, gives 48.8 % and $2.56 bn. The 22.7-point gap is the live break options. The app shows both figures and the gap.
Your spreadsheet is opened inside your browser. It is not uploaded or stored on any server.
Owner, landlord and taxpayer names, personal names, mailing addresses and contacts are removed as soon as the file is read. The app lists the columns it removed.
The 180-property Los Angeles estate is made-up sample data. It says so on the opening screen, the notice bar, every row, every pop-up and every export.
Real, published sources provide the land parcels, the county boundary, wildfire risk zones, the local employment mix and the federal lease list. Only the 180 demo properties are made up.
The app was tested with real files in a real browser before release, including checks that the sample-data labels switch off when you load your own estate.
These limits are also written into the app's own documentation. The tax-rule view is always labelled as a first check, not a ruling.
Press Your estate and choose a file from your computer: a CSV spreadsheet or a GeoJSON map file. The map, the counts and the timeline all switch to your properties. One button brings the demo back.
First, where each property is: an ID, a name, and coordinates or an address. Then what it is: tenure, use, floor area, lease expiry and break date. The app guesses each column and you can correct it from a list.
Owner, landlord and other personal columns are removed before anything else happens. The app shows you which ones.
A property with no location is listed but not mapped. One with no date is left off the timeline and counted. Nothing is made up.
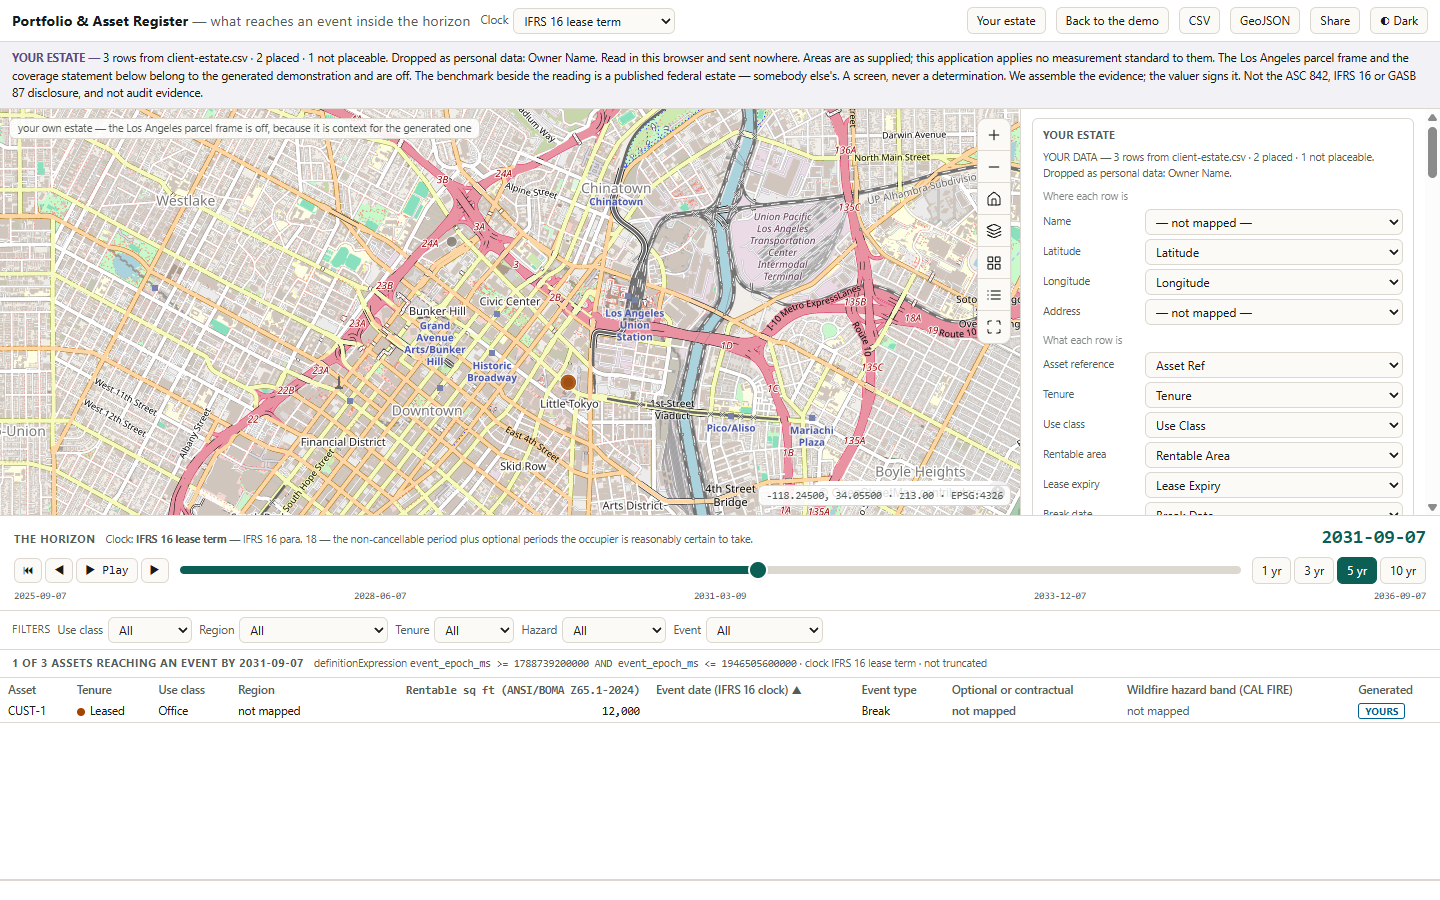
A three-property test file. The notice bar says YOUR ESTATE and names the removed column. One of the three properties falls inside the horizon.
Your file never leaves your browser. Nothing is uploaded or kept on a server. The Los Angeles parcel layer switches off for your data, because your properties may be in Riyadh or Leeds.
All you need is a list of what you own and lease, with a location, tenure, floor area and the key lease dates your team already uses. We open it on your laptop in the room. Nothing is sent anywhere.
It adapts to your market. The map layers and the risk data are changed in settings, without new code. The timeline and the tenure view are not tied to US rules. If you already run a lease system, you can feed your own data in and keep it.